


Investing 101 : Reading the Financial Statements - Part 1
The Balance Sheet
In this 4 Part series, we will delve into the basics of reading Financial Statements and gaining an understanding of a company’s performance. As Warren Buffett once said:
Accounting numbers, of course, are the language of business and as such are of enormous help to anyone evaluating the worth of a business and tracking its progress. Charlie and I would be lost without these numbers: they invariably are the starting point for us in evaluating our own businesses and those of others

What are Financial Statements?
They are a report of a company’s financial position or performance. There are various types of financial statements. The Income Statement, Balance Sheet and Cash Flow Statement are the most popular and widely reported ones
Few investors go through the financial statements of a company. They usually just look at some basic numbers and see if it is a fast growing company in a hot industry. More often than not, such a process leads to below average returns for the Investor over the long run.
We can gain an edge over the others by taking the time and effort to go through these statements and understanding the attributes of the business
You can find these financial statements in a company's annual or quarterly reports. They can be accessed from the company's investor relations page. For instance, you can find Apple's annual and quarterly reports here.
These reports generally have an Index which we can use to quickly find what we want. This is important because these reports tend to be large complex documents, but not all of the information given is equally important. You’ll need to focus only on what matters.
What is the Balance Sheet?
It is a snapshot or a statement showing what a company owns (Assets), what it owes to others (Liabilities) and what shareholders are entitled to. It is crucial to assessing the financial strength of the company. The Balance Sheet of any company has 3 sections:
Assets
Liabilities
Equity
Assets
It refers to what a company owns and how much of it. It divides Assets into Current and Non-Current Assets. Current Assets are those that are converted into cash within a year, typically items such as Inventory and Trade Receivables (Amount due for Goods sold on Credit)
Non-Current Assets are not expected to be converted into cash within a year and generate benefits over a long period of time. This includes Property, Plant and Equipment and Long Term Investments.
Liabilities
Liabilities are what a business owes to others. They can be divided into Current and Non-Current Liabilities.
Current Liabilities are short-term obligations that are meant to be settled within a year, such as Trade Payable (Amount due for Goods bought on credit) and Short Term Loans
Non-Current Liabilities are long-term obligations that are not expected to be settled within the next year, such as Long Term Debt

Equity
This is the part of the company’s assets available to shareholders. It is the difference between Assets and Liabilities. Some companies may even have negative equity! This means that Total Liabilities are greater than Total Assets
Apple’s Shareholders Equity totalled to 65 Billion as of 2023!
Key Indicators
Current Ratio - Measures the ability of a company to meet short-term obligations. Calculated as Current Assets/Current Liabilities
Quick Ratio - Similar to the Current Ratio, except it does not take the value of Inventory into account
Net Debt - Calculated as Total Debt less Cash and Short Term Investments. It shows how much Debt a company will have remaining after paying it off immediately with Cash on hand. It is tremendously useful when we compare it in relation to Earnings or Cash flows
Example
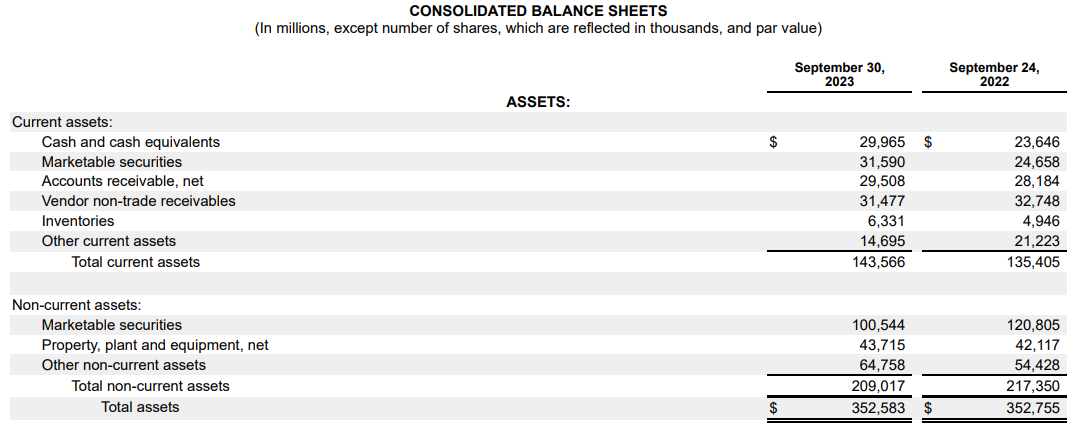
We will try to calculate the values for the above Indicators from Apple’s annual report filed on November 3, 2023. (Page 33 of the 10-K)
Current Ratio - Apple’s Current Assets of 143 Billion and Current Liabilities of 145 Billion give us a current ratio just under 1. It is not ideal, but should be fine since Apple generates significant earnings and has a fantastic CEO in Tim Cook
Quick Ratio - Inventories were 6 Billion, so Apple’s quick ratio is also just under 1 (137/145)
Net Debt - Apple has total Debt of around 110 Billion! (Term Debt + Commercial Paper) However, it also has Cash of 60 Billion (Cash + Marketable Securities), giving us Net Debt of 50 Billion. It should be noted that Apple has 100 Billion in Non-Current marketable securities too, so they could use that to pay off the Non-Current Debt as it comes due. Taking that into account, Apple has a Net Cash position! (110-60-100 = -50)
Conclusion
Even though various platforms provide us with pre-calculated ratios, delving into the annual reports is crucial for a detailed understanding of the company.
Examining Apple's debt structure, you see that the company has issued Notes ( a type of Debt security) at interest rates that are near zero
Flipping to page 64 reveals that in November 2019, Apple issued 1 billion Euros of debt at a 0% interest rate. No, that’s not a typo. Apple seized the opportunity presented by historically low interest rates to secure cheap capital, which could then be strategically reinvested into the business at a higher rate of return.
This wraps up our analysis of the Balance Sheet!
Thank you for your time and subscribe to be a part of this journey of lifelong learning!
Disclaimer: I do not hold a position in Apple or Berkshire Hathaway as of the date of publishing